
How Bookmap Helps Stock Traders Understand Order Flow
Bookmap helps stock traders understand order flow by visualizing market liquidity, tracking buy and sell orders, and revealing trading activity that traditional price charts may miss.

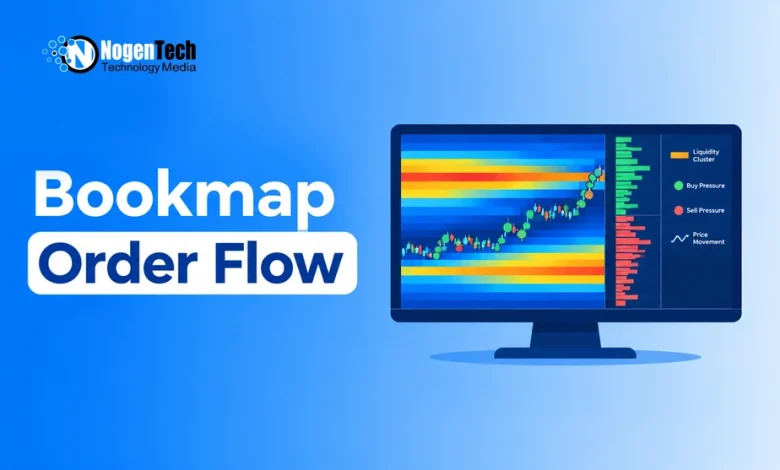
Candlestick charts show how stock prices move, but they don’t always explain the buying and selling activity behind those movements. Tools for S&P 500 market analysis can help traders follow broader price trends, but they don’t necessarily show the liquidity behind individual trades. Traders relying only on charts may miss important changes in market liquidity.
- Order flow analysis fills this gap by showing how buy and sell orders interact, where liquidity is concentrated, and how trading activity affects prices.
- Bookmap makes this information easier to interpret through liquidity heatmaps, volume indicators, and historical order book data.
Here’s how Bookmap gives stock traders an edge by helping them analyze market activity and make more informed trading decisions.
What Is Order Flow in Equity Trading?
Order flow analysis examines how buy and sell orders interact in the stock market. Unlike traditional technical analysis, which focuses mainly on historical prices, order flow reveals current trading activity and available liquidity.
Two types of orders drive this activity:
- Market orders: Execute immediately against available liquidity, with the final price depending on market conditions.
- Limit orders: Specify a price or better and may remain in the order book until filled or canceled.
According to the U.S. Securities and Exchange Commission, market and limit orders serve different purposes when buying or selling securities.
Aggressive buyers execute against sell orders at the ask, while aggressive sellers execute against buy orders at the bid.
When buying or selling pressure consumes available liquidity, prices may move toward the next available orders. These basic order mechanics also help explain how crypto markets work, although market structure differs between cryptocurrencies and equities.
This activity involves several market participants, including retail traders, institutional investors, market makers, and high-frequency trading firms. Each contributes to market liquidity through different trading strategies.
By examining these interactions, traders can better understand short-term price movements rather than relying entirely on candlestick patterns.
How Bookmap Visualizes the Limit Order Book
The limit order book contains outstanding buy and sell orders at different price levels. Nasdaq’s explanation of depth-of-book data shows how this information helps traders examine available liquidity across price levels. Traditional Level 2 screens display market depth, but tracking how orders change over time can be difficult.
Bookmap simplifies this information through a liquidity heatmap, which uses color intensity to represent concentrations of displayed limit orders.
Stronger colors indicate higher liquidity concentrations, while less intense areas represent thinner liquidity. The heatmap helps traders identify:
- Large buy and sell walls that may influence price movements.
- Persistent liquidity that remains available over time.
- Order cancellations as prices approach important levels.
- Changes in market depth during breakouts and reversals.
Unlike a conventional order book display, Bookmap also shows how liquidity has changed over time. This helps traders understand whether an important price level has consistently attracted orders or only recently developed buying or selling interest.
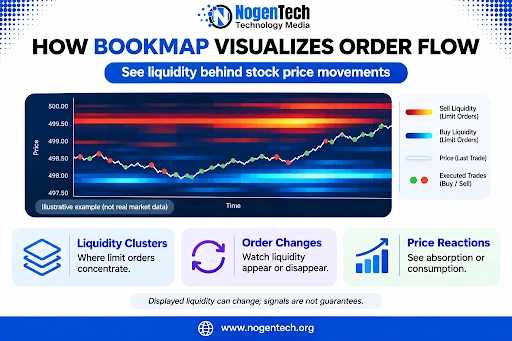
However, the visibility of market liquidity depends on the connected data feed. A single equity market feed may not capture orders across every trading venue.
Identifying Liquidity Clusters and Large Orders
Liquidity clusters are price levels where significant numbers of limit orders are concentrated. These areas can influence price behavior by providing potential support or resistance.
For example, a large concentration of sell orders above the current price may slow an upward move. Similarly, substantial buy liquidity below the market may temporarily absorb selling pressure.
When price reaches a liquidity cluster, traders typically watch for two outcomes:
- Liquidity absorption: Resting orders absorb aggressive buying or selling, potentially slowing or reversing price.
- Liquidity consumption: Aggressive orders execute through available liquidity, potentially allowing price to continue moving.
Bookmap helps traders examine these situations by tracking whether large orders remain in place, disappear, or are consumed.
What to Look for in Large Orders
- Persistent liquidity: Large orders that remain visible over time.
- Price reactions: Whether price slows, reverses, or breaks through a liquidity zone.
- Order withdrawal: Liquidity that disappears as price approaches, potentially weakening expected support or resistance.
- Aggressive trading: Large market orders that consume liquidity at important levels.
These observations can help traders evaluate potential entry points, profit targets, and stop-loss placement. Similar principles of entry and exit point analysis also apply to other markets, including silver, although the tools and market conditions differ.
However, displayed liquidity can disappear without warning. A large buy or sell wall should never be treated as guaranteed support or resistance.
Understanding Price Action Through Heatmap Patterns
Price charts reveal where a stock has traded, while Bookmap’s heatmap adds context about how liquidity changes around those prices.
For example, if a stock falls toward a large buy wall and aggressive selling fails to push it lower, buyers may be absorbing the selling pressure.
If that buy wall disappears before price reaches it, the expected support may weaken. Several heatmap patterns are particularly useful:
- Liquidity absorption: Significant trading volume occurs without substantial price movement.
- Liquidity withdrawal: Previously visible orders disappear, changing available support or resistance.
- Liquidity replenishment: New limit orders replace executed orders at the same price.
- Liquidity consumption: Aggressive orders remove resting liquidity, potentially allowing price to move further.
These patterns help traders assess buying and selling pressure during breakouts, reversals, and periods of increased volatility.
However, heatmap activity does not reveal the exact intentions or identities of market participants. A canceled order, for example, does not automatically indicate market manipulation.
Spotting Iceberg Orders and Hidden Liquidity
Large institutional traders may avoid displaying their full order sizes to reduce their potential impact on the market.
One method involves iceberg orders, which display only part of a larger order. As the visible portion executes, additional quantities may become available at the same price.
Because the full order is not displayed, conventional Level 2 screens may not reveal its actual size. Bookmap’s order flow visualization and specialized analytical tools can help identify activity consistent with hidden liquidity.
For example, substantial selling may occur at one price while the displayed bid continues replenishing and the stock fails to move lower. This may indicate a hidden buyer absorbing sell orders.
Common Signs of Potential Iceberg Orders
- High trading volume at one price without significant movement.
- Repeated replenishment of displayed order size after executions.
- Frequent transactions at the same price in time and sales data.
- A sudden price reaction when the absorbing liquidity is exhausted.
These signals can help traders identify potential hidden buying or selling interest. However, repeated executions do not necessarily confirm an iceberg order.
Similar patterns can result from multiple independent limit orders, and detection capabilities depend on the available data and tools.
Combining Order Flow with Technical Analysis
Order flow works best as an additional layer of information rather than a replacement for traditional technical analysis.
Indicators and chart patterns help traders identify potential opportunities, while order flow provides context about the trading activity supporting those signals. However, just like crypto price predictions, these signals cannot guarantee future price movements.
Breakout Trading
A breakout occurs when price moves beyond an established support or resistance level. However, not every breakout leads to a sustained move. Order flow helps traders examine:
- Whether aggressive buying or selling supports the breakout.
- Whether resting liquidity is consumed or replenished.
- Whether executed trading volume increases.
- Whether price holds beyond the broken support or resistance level.
For example, a move above resistance accompanied by aggressive buying and sustained volume may indicate stronger buyer participation than a breakout with limited trading activity. Still, strong order flow cannot guarantee that a breakout will continue.
Mean Reversion Trading
Mean reversion strategies look for opportunities when price becomes overextended and may return toward an average or trading range.
Traders sometimes combine indicators such as the Relative Strength Index (RSI) with liquidity information. For example, if a stock reaches an overbought RSI reading near a large sell liquidity cluster, traders can watch whether sellers begin absorbing aggressive buying.
If buying pressure weakens and price struggles to advance, the activity may support a potential reversal setup. However, overbought conditions and liquidity clusters do not guarantee reversals, particularly during strong trends.
Using Time and Sales for Better Trade Execution
Time and sales, also called the tape, records executed trades, including their prices, sizes, and timestamps. The distinction is simple: the limit order book shows displayed trading interest, while the tape shows completed transactions.
This matters because limit orders can be canceled before execution, while completed trades provide evidence of actual buying and selling activity.
Bookmap combines this information with its heatmap, allowing traders to examine resting liquidity and execute transactions together. Tape reading can help traders:
- Monitor the speed and size of executed trades.
- Identify increased activity near support and resistance.
- Compare aggressive buying and selling with available liquidity.
- Evaluate whether price movements have sustained trading activity.
For example, a rapid sequence of trades near resistance may indicate increased market activity. Traders can then examine whether buyers are consuming sell liquidity or struggling to push price higher.
This additional context can support execution decisions, although risks such as slippage, volatility, and sudden liquidity changes remain.
Lastly, How to Start Using Bookmap for Stock Order Flow Analysis
Order flow generates substantial information, so beginners should focus on a few practical observations before incorporating it into live trading.
- Start with one liquid stock: Observe a heavily traded equity to become familiar with its typical volume and liquidity patterns.
- Identify major liquidity zones: Use the heatmap to locate significant buy and sell concentrations and monitor how they change.
- Watch price reactions: Observe whether liquidity is absorbed, consumed, or withdrawn when price reaches important levels.
- Look for potential iceberg activity: Compare executed volume with displayed order size to identify possible replenishment or hidden liquidity.
- Confirm existing trading signals: Use order flow alongside technical levels, indicators, and risk management rules rather than relying on one signal.
Practicing these observations in a simulated trading environment can help traders learn to interpret order flow before risking capital.