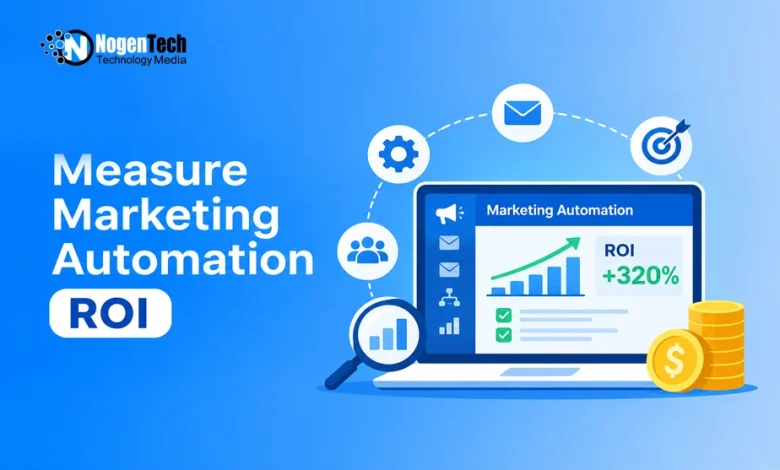
How to Measure and Prove Your Marketing Automation ROI
You can measure marketing automation ROI by tracking incremental revenue, customer acquisition costs, conversion rates, and operational savings against your total automation investment.

Marketing automation can improve email engagement, streamline lead nurturing, and reduce repetitive tasks. However, higher open rates and click-throughs don’t necessarily mean your investment is generating more revenue.
Businesses invest in a marketing tech stack expecting better conversions and more efficient sales processes. Proving its value requires connecting marketing activities with revenue, customer acquisition costs, and operational savings.
So, how can you measure marketing automation ROI accurately? Here are six approaches to tracking performance and demonstrating the financial impact of automated workflows.
Focus on Revenue Metrics Instead of Vanity Metrics
Email opens and clicks help evaluate campaign engagement, but they don’t show whether marketing automation improves profitability.
To measure business value, focus on metrics connected to sales performance:
- Customer Acquisition Cost (CAC): Track whether automation reduces the cost of acquiring customers.
- Lead-to-Customer Conversion Rate: Measure how many nurtured leads become paying customers and whether AI CRM tools improve lead conversion rates.
- Pipeline Velocity: Track how quickly qualified opportunities move through the sales pipeline.
- Sales Cycle Length: Compare the time required to close deals before and after automation.
- Sales Team Productivity: Measure time saved through automated lead scoring, follow-ups, and qualification.
For example, automated lead nurturing can help sales representatives identify qualified prospects earlier, reducing time spent on leads who aren’t ready to buy.
This can lower acquisition costs and improve pipeline velocity when automation is properly integrated into the sales process.
Track ROI Across the Entire Customer Journey
Marketing automation ROI is harder to measure when customers take months or years to make purchasing decisions.
An online shopper might click an advertisement, receive an automated discount email, and purchase within minutes. B2B software buyers, enterprise clients, and prospective university students often follow much longer journeys.
For example, a student might inquire about a university while still in high school but enroll two years later. Institutions may use higher ed student lifecycle solutions to manage engagement across inquiry, application, admission, and enrollment stages.
Measuring these workflows over only 30 days can produce misleading results.
Instead, align reporting periods with the typical buying cycle. A company with a six-month sales cycle may need six or twelve months of data to evaluate its nurturing campaigns.
Track movement between lifecycle stages as well. Progress from an initial inquiry to a qualified opportunity can indicate positive engagement, even before a purchase occurs. However, these intermediate results should remain separate from actual revenue.
Configure Multi-Touch Attribution in Your CRM
Determining which marketing interactions contributed to a conversion is a major challenge.
Last-touch attribution assigns all conversion credit to the final recorded marketing interaction. For example, a customer might receive automated educational emails for months before clicking a retargeting advertisement and requesting a demonstration.
Under last-touch attribution, the advertisement receives all the credit, overlooking earlier nurturing activities.
Multi-touch attribution distributes credit across recorded interactions. Two common models include:
- Linear Attribution: Assigns equal credit to each recorded touchpoint.
- Time-Decay Attribution: Gives more credit to recent interactions while recognizing earlier ones.
A time-decay attribution model can help assess automated emails that contribute to longer sales journeys.
Effective attribution requires accurate CRM records of lead sources, campaign interactions, lifecycle stages, and closed deals. You may need to update CRM fields or configure API integrations to connect marketing and sales data.
However, multi-touch attribution estimates how revenue credit should be distributed. It doesn’t prove that automation caused a sale.
Use Control Groups to Measure Automation's Actual Impact
A customer purchasing after receiving an automated email doesn’t necessarily mean the email influenced the decision. Some customers would have purchased anyway.
Control groups help measure automation’s incremental impact.
Randomly divide eligible leads into two comparable groups:
- Automation Group: Receives automated nurturing emails, follow-ups, and marketing communications.
- Control Group: Receives standard sales outreach without the automated nurturing being tested.
Compare their conversion rates after an appropriate reporting period.
For example:
| Metric | Automation Group | Control Group |
| Total leads | 1,000 | 1,000 |
| Customers acquired | 120 | 90 |
| Conversion rate | 12% | 9% |
In this hypothetical example, automation produces 30 additional customers and a 33.3% relative improvement in conversion rate. With proper randomization and statistical analysis, this difference can provide evidence of automation’s incremental impact.
Unlike conventional A/B testing that compares subject lines or email designs, this approach evaluates whether automated nurturing improves business outcomes.
Calculate Marketing Automation ROI
Once you have reliable revenue and cost data, calculate the return on your automation investment.
Marketing Automation ROI (%) = [(Financial Benefits − Total Automation Costs) ÷ Total Automation Costs] × 100
Financial benefits can include incremental profit and measurable operational savings. Using incremental gross profit rather than total revenue provides a more accurate picture because additional sales also involve costs.
Consider these hypothetical quarterly results:
| Metric | Amount |
| Incremental revenue | $40,000 |
| Gross margin | 60% |
| Incremental gross profit | $24,000 |
| Verified operational savings | $6,000 |
| Total automation costs | $10,000 |
The calculation becomes:
ROI = [($24,000 + $6,000 − $10,000) ÷ $10,000] × 100 = 200%
In this example, marketing automation generates a 200% return.
This assumes operational savings are financially measurable and aren’t already included in the profit calculation. Include software subscriptions, implementation, integrations, maintenance, and staff time in your total automation costs.
Build an Executive Dashboard That Shows Financial Value
Leadership needs a clear view of automation’s financial impact without examining individual campaigns or thousands of engagement records.
An executive dashboard should prioritize:
- Incremental Revenue: Additional revenue estimated to result from automation.
- Marketing Automation ROI: Financial returns after accounting for costs.
- Customer Acquisition Cost: Changes in customer acquisition expenses.
- Lead Conversion Rate: Percentage of leads becoming paying customers.
- Sales Cycle Length: Changes in the average time required to close deals.
- Operational Savings: Measurable reductions in manual work and expenses.
For example, automated lead qualification may save sales representatives several hours each week. Those hours can be assigned an estimated labor value using employees’ fully loaded hourly costs.
However, saved time should only count as financial savings when it reduces actual expenses or creates measurable additional productive capacity.
The dashboard should also distinguish attributed revenue from experimentally measured incremental revenue to avoid overstating results.
Final Thoughts
Proving marketing automation ROI means connecting automated workflows with measurable business outcomes rather than relying on email engagement metrics.
Multi-touch attribution helps explain how automation contributes to conversions, while control groups provide stronger evidence of its incremental impact.
Combining these insights with accurate cost data and a clear executive dashboard helps businesses evaluate whether their automation investment is delivering financial value.