- AI tools are improving project planning, but they cannot replace human collaboration and decision-making.
- Teams still rely on visual timelines to understand dependencies and manage schedules effectively.
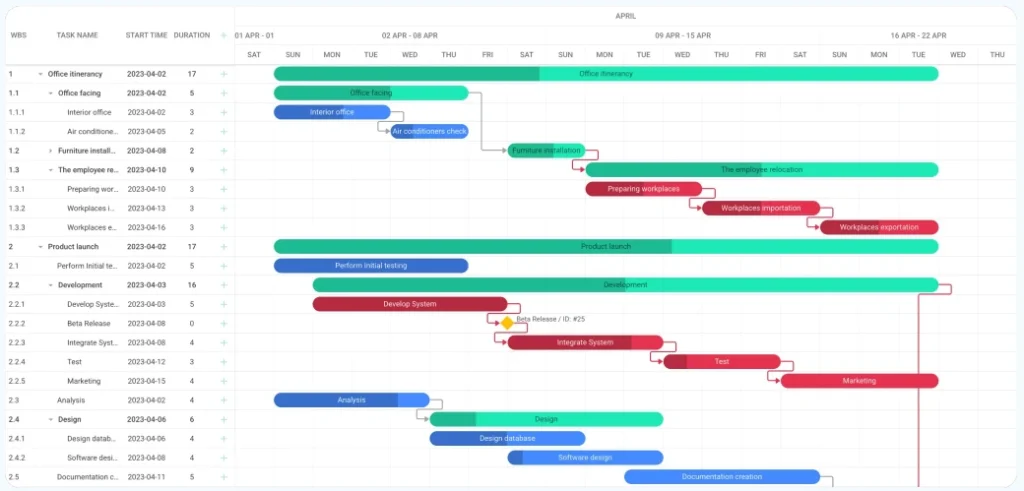
- JavaScript Gantt charts transform planning data into interactive project timelines inside web applications.
- AI-generated schedules often require human validation and adjustments.
- Solutions like DHTMLX Gantt provide scheduling logic, auto-scheduling, and performance needed for large projects.
AI is transforming business operations and the way teams plan projects. These days, many project-management tools can suggest timelines, estimate deliveries, and even recommend how to allocate resources. It’s exciting technology, and it can save teams a lot of time—but it doesn’t always make planning any simpler. Automation can generate schedules in seconds, yet without a clear, shared visual reference, even the most accurate data can be hard to interpret.
That’s why Gantt charts continue to matter. They provide a visual, interactive way to understand project timelines, dependencies, and workloads. With a Gantt chart, teams can review schedules, adjust tasks, and see the ripple effects of every change.
In this article, you will learn why visual timelines still matter, how a JavaScript Gantt chart enhances web-based planning, and why DHTMLX Gantt remains a trusted solution for scheduling.
AI Is Changing Project Planning, but Not Replacing It
AI-assisted planning features are showing up in project-management software more frequently than they did even a couple of years ago. Many platforms can now analyze past project timelines, identify recurring delays, and suggest schedule adjustments automatically. For teams working on complex products, that kind of assistance can noticeably reduce planning time.
Still, AI rarely replaces the planning process itself. It usually acts as a starting point — something teams review, question, and refine together. Developers building planning functionality into web applications often discover that automated scheduling works best when users remain actively involved in shaping the timeline.
Pattern detection is one of AI’s strongest capabilities, but collaboration is not. A model can suggest when a delay might occur, yet it cannot provide the shared visual context teams rely on when discussing priorities, dependencies, and deadlines.
That’s why timeline visualization remains essential in modern planning tools. In many web-based systems, such tools are used to turn AI-generated scheduling data into interactive timelines that users can review, adjust, and trust.
Current Limitations of AI in Project Management
It’s one thing for an AI to suggest a plan; it’s another for a person to trust it. In our experience, teams often need to click through the tasks, drag things around, and double-check that the AI didn’t miss some hidden dependency.
AI tools have improved a lot, but they still trip up in real-world projects. One thing we see all the time is that the AI’s suggestions look fine at first, but once work starts, small inconsistencies pop up.
Maybe a task was scheduled before a blocker was resolved, or a team member’s workload wasn’t considered properly. Teams usually spend a bit of time interpreting and correcting these suggestions before the plan becomes reliable.
That’s why interactive timelines are still essential. Even with AI, people need a clear interface to review schedules, tweak dependencies, and make the plan fit reality.
From Planning Data to Visual Execution in Web Applications
Modern Gantt charts are no longer static project diagrams. In web applications, they function as interactive planning environments where teams actively manage schedules.
A JavaScript Gantt chart enables users to:
- Drag and reschedule tasks directly on the timeline
- Adjust task dependencies visually
- Track progress and workloads in real time
- Test “what-if” scenarios before committing to schedule changes
These capabilities help teams identify potential issues earlier in the planning cycle.
Large projects often involve hundreds of tasks, which can quickly become difficult to manage. High-performance timeline components ensure that even complex schedules remain responsive and easy to navigate.
In this environment, AI suggestions become far more valuable. Instead of replacing human planning, AI provides smarter scheduling data, while teams retain control over how timelines evolve.
For developers building SaaS platforms or internal planning systems, combining AI recommendations with interactive timeline tools has become the most practical approach.
DHTMLX Gantt as the Execution Layer for AI-Assisted Planning
Even when AI generates project schedules, teams still need a reliable execution layer to maintain consistency as plans evolve.
This is where DHTMLX Gantt plays a key role. It combines visual timeline management with robust scheduling logic that supports complex project workflows.
Key capabilities include:
- Auto-scheduling that automatically adjusts tasks when dependencies change
- Critical path analysis to identify tasks that directly impact project deadlines
- Hierarchical task structures where parent and child tasks update automatically
- Resource management tools that help balance team workloads
- Working calendars and scheduling rules for accurate timeline calculations
These features ensure that project timelines remain accurate even when schedules are frequently updated.
Performance is also critical for large-scale applications. Responsive rendering, dynamic loading, and efficient data handling allow it to manage projects with hundreds or even thousands of tasks without performance issues.
Developers also benefit from flexible customization options, API integrations, and export capabilities such as PDF and Excel reporting.
In many enterprise systems, this combination of visual planning and scheduling logic allows AI-driven insights to become actionable project workflows.
Where Gantt Charts Deliver the Most Value
Interactive timelines aren’t just decoration. They actually help teams make sense of complex projects. You see them in all sorts of software these days.
Some common ways teams use Gantt charts include:
- In SaaS dashboards, teams use Gantt charts to coordinate releases. For instance, when two features rely on the same backend update, the timeline helps avoid conflicts.
- CRM tools show long-term sales campaigns. You can see how one client opportunity depends on another, which keeps everyone on the same page.
- ERP workflow apps map operational processes. Teams quickly spot who’s supposed to do what and when, so nothing slips through the cracks.
- Internal planning tools give distributed teams a shared view of deadlines. Everyone knows which tasks are their responsibility.
What we’ve noticed is that these charts do more than just look neat. They let teams really understand dependencies and see when someone might get overloaded. Adding a JavaScript Gantt chart often changes how people work with schedules.
For example, instead of just checking off a list of tasks, someone might notice that Task B can’t start until Task A is finished, and move it around to see the effect on the rest of the project. It’s small adjustments like these that make timelines feel like a tool you can actually use, rather than just a picture of the plan.
Conclusion – Why Gantt Charts Still Matter in 2026?
Artificial intelligence is accelerating project planning, but visualization remains essential for effective execution.
Teams still depend on interactive timelines to coordinate tasks, manage dependencies, and monitor project progress.
A JavaScript Gantt chart component provides this shared planning environment inside modern web applications. When implemented with an enterprise-grade solution like DHTMLX Gantt, developers can deliver powerful scheduling capabilities that integrate seamlessly with AI-assisted planning tools.
Rather than becoming obsolete in the age of automation, Gantt charts are evolving into a crucial bridge between automated insights and real-world project workflows.