As digital marketing evolves at an unmatched pace, leading organizations are shifting away from static marketing models toward adaptive, intelligence-driven systems that enable continuous customer engagement and long-term growth.
This white paper explores how enterprises can design continuous feedback and growth loops powered by Marketing Intelligence. It introduces a strategic framework that unifies real-time customer signals, advanced analytics, and data-driven decision-making to optimize campaigns, accelerate product innovation, and enable personalized experiences at scale.
Through real-world examples and a review of critical data and technology enablers, this paper offers a pragmatic guide for marketing and product teams looking to drive intelligence-led growth. It is designed for CMOs, growth PMs, data scientists, and technical marketers. It aims to inspire a shift toward more agile, insight-driven marketing and growth strategies.
Why Marketing Intelligence Over Traditional Marketing Analytics?
While marketing analytics focuses on explaining data to drive informed decisions, marketing intelligence goes a step further—it enables the creation of self-reinforcing feedback loops driven by continuous learning and optimization.
It emphasizes real-time signals and adopts an AI-first approach to deliver adaptive, dynamic strategies. Though the basic steps remain the same, marketing intelligence transforms the way these steps are executed—an evolution we’ll explore throughout this paper.
4 Steps to Implement Marketing Intelligence
To successfully implement marketing intelligence, 4 core foundational steps are essential:

1. Data Collection
Comprehensive data collection is the first and foremost step in effective marketing intelligence. To achieve accurate attribution and generate actionable insights, organizations must ensure the systematic capture of complete, high-granularity datasets. In the following section, we take a closer look at this foundational step and its implications for data-driven marketing strategies.
Marketing analytics primarily depends on the following FIVE key data categories:
- Orchestration Data – Captures details from the marketing tool (used for omnichannel personalization) about the structure and flow of campaigns. It may include campaign ID, start and end dates, channel/surface, variant ID (for A/B testing), audience segment IDs, and offers/treatment IDs. This captures how a marketing campaign is structured to run baseline or A/B test experiments with different offers for targeted user segments.
- Enrollment Data – Reflects user enrollment information within a campaign, including user ID and entry/exit timestamps for both the campaign and associated audience segments. This tells us when a user was enrolled into a target segment and into the campaign lifecycle, allowing for precise attribution.
- Response Data – Records how users interact with a campaign (e.g., clicks, opens, renders, bounces), typically collected from client applications. These response signals help track how effectively users are interacting with the campaign assets across channels.
- Offline Data – Consists of user behavioral and transactional data that originates outside digital campaigns, often from CRM or in-store systems. Offline behavioral data enriches the user profile and provides context to personalize digital outreach.
- Content Data – Represents the creative elements (e.g., banners, text, images, videos) used in treatments, along with their associated metadata. The served content can be static or dynamic (through an ML recommendation engine or MAB, Multi Armed Bandit system). This records all creative and copy elements used in the campaign and helps assess what content resonated most.
Note – Data latency is critical, particularly for the first three data sets. To enable dynamic, data-driven marketing intelligence, organizations should prioritize collecting these signals in near real-time.
The table below illustrates a hypothetical scenario of Amazon Prime Day ad campaign using all relevant datasets –
Amazon Prime Day Ad Campaign – Key Marketing Data Elements
| Data Type | Example Details |
| 1. Orchestration Data | – Campaign ID: PRIME24_DEALS – Start/End Dates: June 15 – July 15, 2025, – Channel: Mobile App & Web – Variants: A (10% off), B (Free shipping + 5% off) – Audience Segments: SEG_PRIME_MEMBERS, SEG_NONPRIME_HIGHSPENDERS – Offer IDs: OFFER_FREE_SHIP_5, OFFER_10_OFF |
| 2. Enrollment Data | – User ID: U456789 – Segment Enrollment: SEG_PRIME_MEMBERS, enrolled June 16 – Campaign Entry/Exit: June 17 – July 10, 2025 |
| 3. Response Data | – Ad Impressions: June 18, 19, 20 – CTA Click: June 19 (“Shop Prime Day Deals”) – Add to Cart: June 19 – Conversion (Purchase): June 20 |
| 4. Offline Data | – Store Purchase History: Bought Amazon Echo at in-store kiosk (Dec 2024) – Customer Lifetime Value Tier: Gold – Support Chat: Jan 2025 about shipping issue |
| 5. Content Data | – Ad Creative ID: PRIME24_BNR_MOB_1 – Asset Type: Static banner with animation overlay – CTA Text: “Shop Now, Save More” – Metadata: Color = Yellow/Blue, Format = 600×300, Audience = Mobile Users, Variant = A |
Measure of Success – The success of this step is determined by several key factors: the diversity and volume of signals captured, the quality and relevance of those signals, the ease of collection, and the timeliness or freshness of the data.
2. Analytics Enablement
This step focuses on usability and quality of data once it’s integrated or collected. I have highlighted the key activities that need to be taken care of in this step with illustrations from the Amazon Prime Day ad campaign data,
- Data cleaning – Detecting and fixing errors, duplicates, missing values, and inconsistencies.
– Remove duplicate user IDs or invalid entries (e.g., user enrolled twice).
– Standardize campaign dates (e.g., format June 15 → 2025-06-15).
– Fix corrupt content metadata (e.g., Format = 600300 → 600×300).
– Eliminate null values in key fields like CTA Click or Conversion.
- Data transformation – Structuring data into a usable format or applying formulas to derive new variables.
– Convert response timestamps into session duration (e.g., Click → Purchase = 1 day).
– Normalize segment names (e.g., SEG_NONPRIME_HIGHSPENDERS → nonprime_high_value).
– Create flags like converted = true/false or variant_group = A/B based on Offer ID.
– Bucket Customer Lifetime Value into numerical tiers (Gold → Tier = 3).
- Data mapping – Aligning fields across different datasets for integration or joining purposes.
– Join Campaign ID from Orchestration data with Ad Creative ID from Content data using Offer ID as the bridge.
– Map User ID from Enrollment with corresponding Response actions.
– Align Offline purchase data (e.g., in-store Echo purchase) to the same user ID as online behavior.
– Ensure consistent naming of segments across systems.
- Data aggregation – Summarizing detailed data for reporting, KPIs, or modeling at higher levels.
– Aggregate impressions, clicks, conversions per campaign variant (A vs. B).
– Calculate conversion rate by segment (e.g., Prime vs. Non-Prime).
– Roll up creative performance across asset types (e.g., mobile vs. web).
– Compute average time-to-convert from click to purchase.
– Group CLV by channel to understand ROI across offline and online behaviors.
Measure of Success – The success of this step hinges on how quickly and easily data stewards. Analysts and data scientists can run ad-hoc queries and create reports or dashboards using the aggregated data.
3. Reporting and Visualization
The first two steps focus on collecting and preparing the data for analysis. This next step transforms the processed data into dashboards and reports, making insights both accessible and actionable.
While numerous metrics can be tracked, priorities often vary by enterprise and even within teams across the same organization. In this framework, we take a comprehensive approach—balancing tactical KPIs that support daily campaign execution with strategic insights that inform enterprise-level decisions. This ensures visibility into performance across campaigns, audiences, channels, and content, helping teams optimize for both immediate impact and long-term growth.
Tactical KPIs:
Below are some of the key metrics that most teams care about and build their dashboards accordingly. This helps teams measure the efficacy of their marketing experiments.
| Metric | Why it matters |
| Reach | Assesses the scale of personalization across intended audiences |
| CTR (Click Through Rate) | Indicates engagement with tailored content and calls-to-action |
| CLTV (Customer Lifetime Value) | Shows impact on long-term revenue and loyalty |
| Engagement Rate | Highlights time, depth, and frequency of interactions |
| Conversion Rate | Measures if targeted experiences drive desired actions |
| Retention/Repeat Rate | Captures loyalty and ongoing value post-personalization |
| Bounce Rate | Flags if messaging/content isn’t relevant or effective |
| CSAT/NPS | Direct user perception and satisfaction with personalization |
| ROI/Revenue Uplift | The bottom-line financial success of personalized campaigns |
Strategic Insights:
Let’s consider the broader strategic priorities that matter to enterprises. At the core of any marketing initiative lies the goal to accelerate revenue growth, elevate customer experience, and foster lasting customer loyalty. Achieving these goals requires more than tracking day-to-day KPIs—it calls for deeper, strategic insight.
This is where comprehensive marketing intelligence becomes a competitive edge. It helps organizations focus on what truly matters and make smarter investment decisions. It also lays the foundation for continuous optimization, which we’ll explore in the next section.
We’ll focus on three strategic insight areas that should be top-of-mind for any enterprise. I’m prioritizing at the team level, focusing on insights that strengthen individual teams (P1, P2) before scaling up to benefit the entire organization (P3).
- P1 – Campaign Performance
- P2 – Channel & Content Effectiveness
- P3 – Audience Understanding
Campaign Performance
This should surface key performance metrics that help teams evaluate the effectiveness, efficiency, and impact of their campaigns. Below is a dashboard illustration for Campaign Performance.
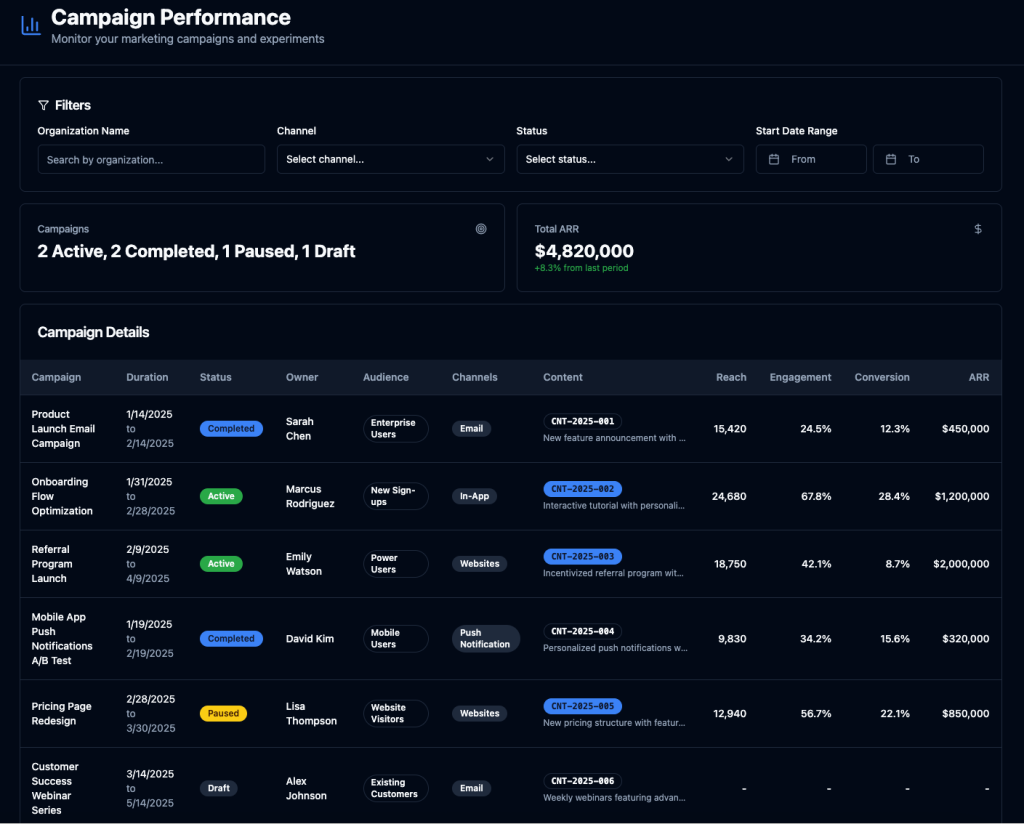
Most elements in the dashboard above are interactive. For example, clicking on a Campaign navigates to its configuration view; selecting Audience opens the definition and size details; and clicking on Content reveals metadata, including associated assets like text, images, or video.
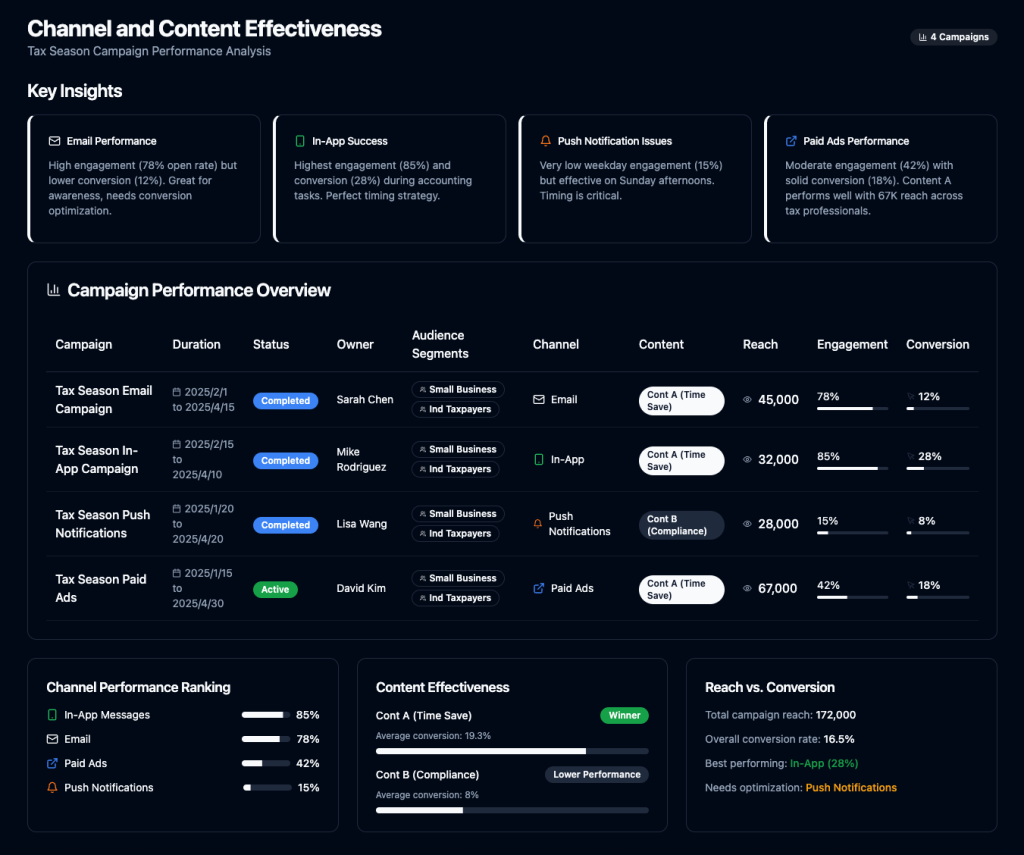
Channel & Content Effectiveness
It’s the ability for marketing and product teams to measure and understand which communication channels (e.g., email, in-app, push notifications, SMS, paid media) and what content (e.g., offers, messages, visuals, CTAs) are driving the most engagement, conversions, and ROI—for specific audiences and use cases.
Consider a Tax Season use case aimed at encouraging small business users and individual taxpayers to adopt QuickBooks’ new AI-powered tax assistant. To support this goal, four distinct campaigns were launched across four marketing channels: Email, In-App, Push Notifications, and Paid Ads. The dashboard below showcases key metrics and insights that surface the effectiveness of both channels and content in driving user engagement and adoption
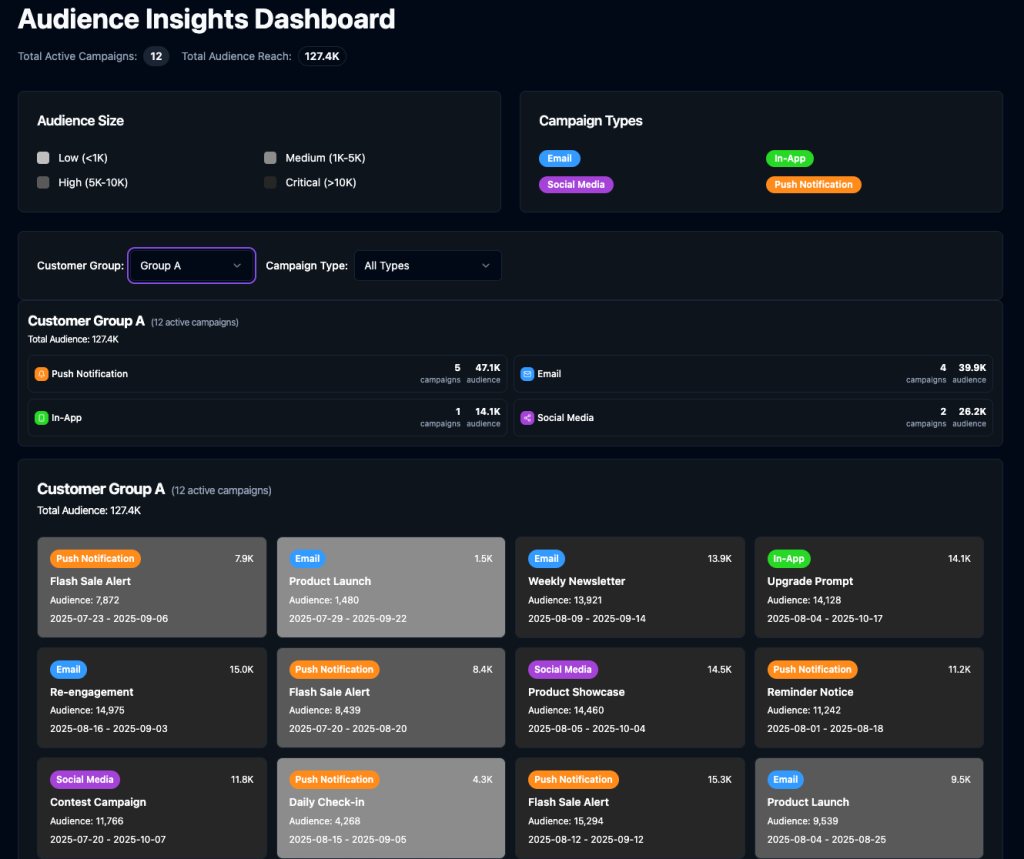
Audience Understanding
This is a critical insight area for enterprises to ensure users have a consistent experience without feeling overwhelmed by too many messages. But you shouldn’t do it at team specific micro-segment level, technically you can, but it won’t add much value.
Hence, organizations need to define (if they have not) a few key macro audience segments based on demographic, purchase behavior, and interests (usage, web visits) that stay consistent across teams. These core segments form the foundation of marketing efforts. It’s important to understand how these audiences interact across all campaigns—specifically, which campaigns reach them most and how those campaigns are performing.
The sample dashboard below illustrates this idea of Audience Understanding.
You can’t report everything; some of the most meaningful insights come from asking the right deeper questions. Hence implementing an LLM powered chatbot is essential to empower users to interact and derive deeper insights through NLP. A few examples below,
- Which 10 campaigns drove the highest engagement for my organization in Q2 2025?
- Which Instagram content generated the highest click-through rate in Japan?
- What are the top 2 most effective channels and content combinations for my target audience, as observed over the past year of experimentation?
- …
Measure of Success – This step is successful if technical marketers, growth managers, and product managers are effectively empowered to independently access timely, actionable insights on campaigns, content, channel ,and audience when they need them most.
4. Optimization
This step is centered on leveraging insights to refine marketing strategies, campaigns, and user experiences consistently. In essence, it transforms insights into action, enabling organizations to maximize the return on investment (ROI) from their marketing efforts.
In terms of maturity, we can divide the enterprises into three main categories –
a) Advanced – Enterprises with mature data collection, analytics enablement, and end-to-end reporting capabilities.
b) Intermediate – Enterprises with solid data collection but fragmented or siloed analytics, limiting full reporting potential.
c) Beginner – Enterprises are still building foundational capabilities in data collection and analytics enablement.
While advanced enterprises can readily optimize and scale, intermediate and beginner organizations must first strengthen their foundational capabilities. Instead of diving into maturity levels, I’ll focus on the key optimization opportunities.
Audience Optimization (Who)
It’s the process of creating much smaller, more specific, and highly defined groups based on a combination of multiple attributes and behaviors, primarily by applying rules + AI. It’s about finding the “niche within the niche.”
Example: Netflix analyzes engagement patterns, viewing history, device usage, and time-of-day preferences to refine user segments beyond traditional demographics. Instead of promoting a new sci-fi series to all sci-fi fans, Netflix identifies microcohorts using behavioral and contextual data:
- Micro Cohort A: Viewers aged 25–34 who binge-watch sci-fi content on weekends, mostly using smart TVs, and prefer character-driven narratives (based on completion rates and rewatch behavior).
- Micro Cohort B: Mobile-first users aged 18–24 who engage more with fast-paced, action-heavy shows and often pause or abandon long-form content.
Netflix personalizes:
- Homepage carousels: Micro Cohort A sees the new series highlighted with a “from the creators of [past favorite]” tagline and a trailer focused on story.
- Push notifications: Micro Cohort B receives a teaser clip under 30 seconds via mobile with a bold “Adrenaline Drop Friday” theme, optimized for vertical viewing.
Content Optimization (What)
The process to rapidly experiment and identify winning contents either through A/B test or MAB (Multi Armed Bandit)
Example: Amazon leverages real-time content optimization to drive higher ad performance across its massive retail media network.
For instance, during a Prime Day campaign in 2025, Amazon runs Multi-Armed Bandit (MAB) tests across various creatives promoting smart home devices. Each creative variant differs subtly—one highlights price drops, another focuses on customer reviews, and a third emphasizes energy efficiency benefits.
As users engage, Amazon’s optimization engine analyzes click-through rates, conversion rates, and bounce rates segmented by customer segments (e.g., tech enthusiasts vs. first-time buyers). Within hours, underperforming creatives are dropped, and winning variants are dynamically scaled across channels, including the website, app, and even Fire TV banners.
Timing Optimization (When)
It’s not just the timing of the day, but it’s the ability to ensure your perfectly tailored message arrives when the customer is most receptive, most in need, or most likely to take the desired action.
Example: YouTube employs advanced timing optimization to maximize ad engagement by aligning content delivery with users’ intent and attention cycles.
YouTube’s AI models analyze a user’s watch history, time-of-day behavior, device usage, and even location context (e.g., commuting, at home, on a break) to predict the optimal moment for ad placement.
Consider a user who regularly watches fitness content around 7 a.m. on weekdays. YouTube recognizes this pattern and schedules a 30-second ad for a new smart water bottle from a DTC brand precisely during this morning routine—not the night before, not during lunch. The user is more likely to click and convert because the product is contextually relevant and shown at a time of habitual interest in health and wellness.
Furthermore, YouTube suppresses ad delivery if the user has recently skipped or ignored similar ads, optimizing for message freshness and receptivity. This reduces ad fatigue while ensuring that promotional content lands just in time, not just in place.
Channel Optimization (Where)
It is the process of delivering the right personalized message through the most effective and preferred communication channel (a.k.a. channel affinity) for each individual customer, at the right time.
Example: Spotify leverages real-time behavioral signals and channel preferences to optimize how and where users receive personalized recommendations.
For instance, if a user consistently engages with Spotify’s in-app notifications but rarely opens marketing emails, the platform prioritizes in-app banners and push notifications to promote newly released albums, concert alerts, or curated playlists.
Imagine a user who frequently listens to indie music and has a history of interacting with concert notifications. When an indie artist the user follows announces a local show, Spotify detects that the user is currently active in-app and instantly delivers a concert promotion via an in-app card, followed by a push notification later that evening if no action is taken.
On the other hand, a user who tends to open Spotify’s “Discover Weekly” email every Monday morning will receive album release updates and podcast recommendations via email timed to land just before their regular commute.
Measure of Success – The effectiveness of this step is determined by how easily technical marketers, growth managers, and product managers can fine-tune audience, content, timing, and channel strategies to drive maximum impact from their marketing campaigns.
The Feedback and Growth Loops
The below picture breaks down how feedback and growth loops are created.
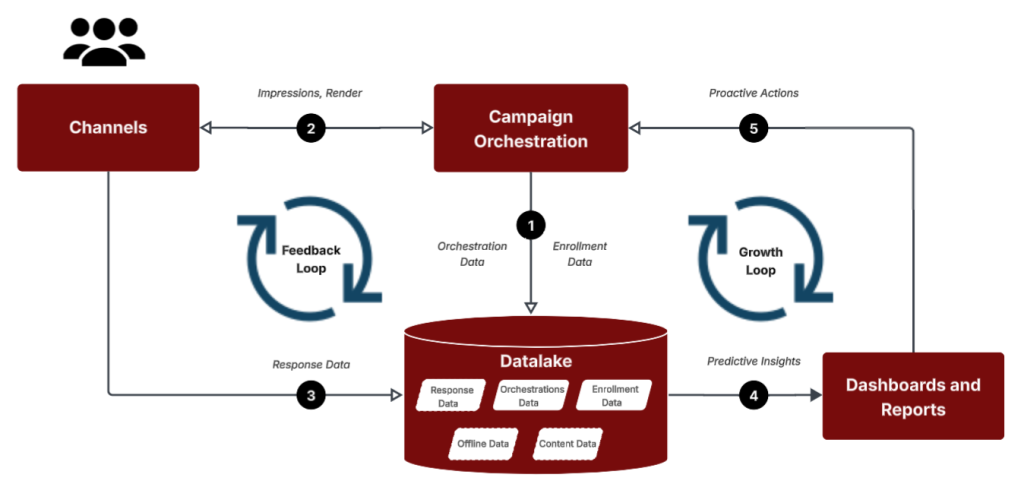
Feedback Loop:
- Step 1: A user is enrolled in a campaign and progresses through its lifecycle, generating enrollment and orchestration data.
- Step 2: The campaign delivers an experience (or series of experiences) across channels such as email, in-app, social, or push, producing render and impression data.
- Step 3: The user reacts to the experience, generating response data (e.g., CTA clicks).
Closing the feedback loop requires capturing all three data sets in a unified data lake, along with offline signals and content metadata, to build a complete view of delivered experiences and user feedback.
Growth Loop:
- Step 4: With the feedback loop in place, we can generate predictive insights (as outlined above in Strategic Insights) that trigger proactive actions in a matter of days.
- Step 5: These actions i.e., refining the audience, adjusting channels or optimizing contents produce an improved version of the campaign. Repeating this cycle drives continuous iteration until desired outcomes are achieved, forming a growth loop.
Having explored how feedback and growth loops are created, the next step is to focus on three essential factors for scaling them at the enterprise level:
- System Integration – Orchestration tools, channels, data pipelines (enrollment, response, content, and offline data), data lake, and dashboards must function as a unified ecosystem.
- Data Latency – Data from the loops should be captured in near real-time to enable timely, contextual decisions and actions.
- AI-First Approach – To enable autonomy, predictive insights, and proactive actions, enterprises need an AI-first mindset. AI can uncover patterns across users, campaigns, channels, and content, then recommend tailored options with higher chances of achieving desired outcomes.
Conclusion
Achieving success requires a structured and deliberate approach. Organizations must begin by building strong marketing intelligence through four foundational steps: data collection, analytics enablement, reporting and visualization, and optimization.
With this foundation in place, the next priority is implementing feedback and growth loops and scaling them effectively through system integration, low-latency data flows, and an AI-first mindset.
By following this strategic path, enterprises can unlock sustainable, intelligence-driven growth and position themselves for long-term competitive advantage.