Monitoring iOS applications in 2026 requires tools that can handle the complexities of closed ecosystems, device fragmentation, and increasingly advanced app architectures. The best iOS app monitoring tools—such as Embrace, New Relic, Datadog, Bugsnag, Sentry, HeadSpin, Catchpoint, Coralogix, and Groundcover—offer features ranging from deep mobile session visibility and error tracking to enterprise-scale observability and real-device testing.
If you’ve ever launched an iOS app, you know the thrill of seeing those first downloads—and the frustration when users complain about crashes, lag, or confusing navigation. In 2026, apps are more complex than ever, powered by AI, cloud integrations, and personalized experiences. That means monitoring tools aren’t just optional, they’re essential.
Think of app monitoring as your app’s health tracker. Just like a smartwatch tells you when your heart rate spikes, monitoring tools tell you when your app slows down, crashes, or loses users.
Top 10 iOS App Monitoring Tools
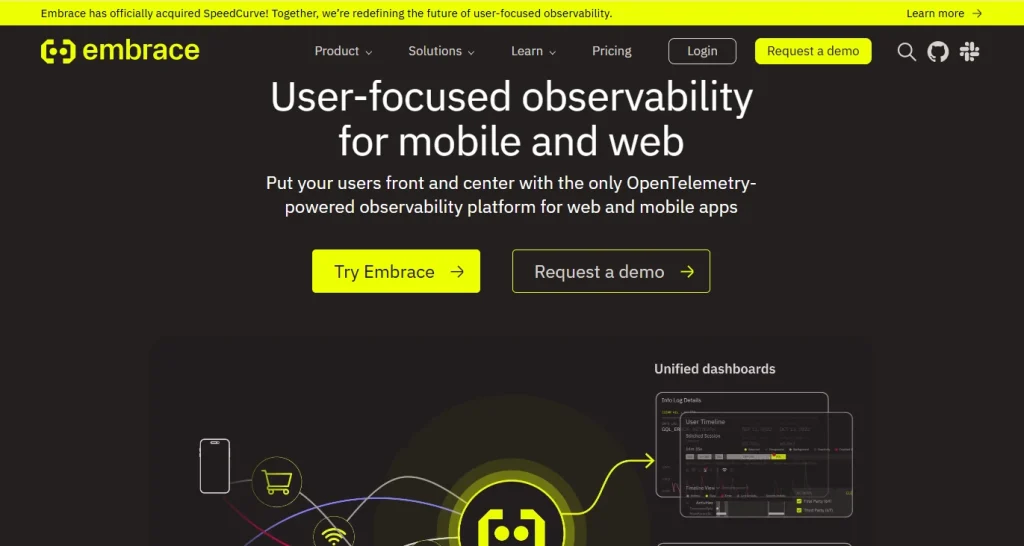
1. Embrace
Embrace is a mobile-focused application performance monitoring platform designed to address the unique challenges of closed ecosystems and device fragmentation. It provides comprehensive visibility into app performance, user sessions, and device-specific issues, enabling efficient debugging and data analysis. The platform is tailored to simplify complex workflows and reduce the overall cost and effort associated with mobile monitoring.
Key Features:
- Session-based performance monitoring captures the entire user journey.
- Device and OS fragmentation analysis highlights performance trends across devices.
- Automated issue detection and alerting reduce manual monitoring effort.
- Detailed crash and error reporting accelerates root cause analysis.
- Real-time data visualization supports rapid decision making.
| Pros | Cons |
|---|---|
| Specialized for mobile ecosystems, ensuring relevance for iOS app monitoring. | Primarily focused on mobile platforms, with limited support for web or backend applications. |
| Strong support for device fragmentation, critical for the wide variety of Apple devices. | May require integration effort for legacy systems. |
| Streamlined debugging workflows reduce engineering time. | |
| Comprehensive session data offers end-to-end visibility. |
- Pricing: Contact Embrace for a customized quote.
- Best For: Mobile-first organizations seeking deep visibility into app performance across fragmented devices and closed ecosystems.
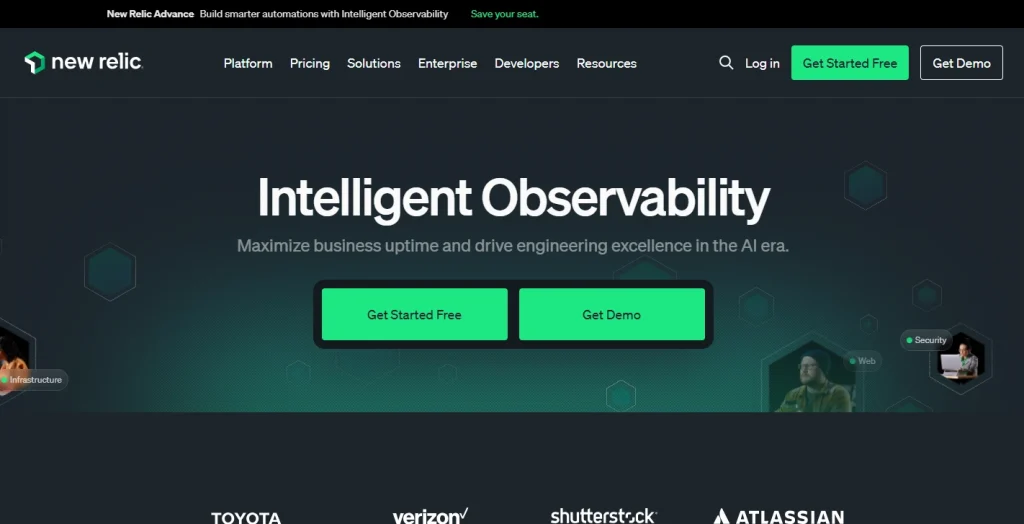
2. New Relic
New Relic is a comprehensive application performance monitoring platform that supports a wide range of environments, including mobile and web applications. It offers tools for monitoring, debugging, and analyzing performance data, helping teams manage complexity and costs associated with fragmented device landscapes and closed platforms.
Key Features:
- Full-stack performance monitoring provides oversight from frontend to backend.
- Real-time analytics and dashboards facilitate data-driven decisions.
- Error tracking and alerting ensure quick identification and response.
- Support for multiple platforms and environments increases flexibility.
| Pros | Cons |
|---|---|
| Broad ecosystem support enables unified monitoring across applications. | Complex interface can be challenging for new users. |
| Scalable for large organizations with complex infrastructure. | Advanced features may incur high costs. |
| Significant configuration may be required for optimal setup. |
- Pricing: Tiered based on features and data volume; contact New Relic for details.
- Best For: Enterprises needing unified monitoring across web, mobile, and backend systems in complex environments.
3. Datadog
Datadog provides cloud-based monitoring and analytics for applications, infrastructure, and logs. It helps organizations address device fragmentation and closed ecosystem challenges by offering integrations and real-time insights for debugging and performance analysis.
- Features:
- Real-time application and infrastructure monitoring for proactive management.
- Customizable dashboards allow tailored visualization of key metrics.
- Error and anomaly detection supports quick troubleshooting.
- Extensive integrations with third-party tools expand observability.
| Pros | Cons |
|---|---|
| Comprehensive monitoring capabilities for diverse environments. | Steep learning curve for complex setups. |
| Flexible integration options adapt to existing workflows. | Costs can increase significantly with scale. |
| Scalable for organizations as they grow. | Additional configuration may be needed for mobile-specific insights. |
- Pricing: Based on number of hosts, features, and data retention; contact Datadog for a quote.
- Best For: Organizations seeking a unified monitoring solution for both cloud and on-premises environments, including mobile and web apps.
4. Bugsnag
Bugsnag is an error monitoring and reporting tool designed to help teams identify, prioritize, and resolve application errors. It is particularly useful for debugging across fragmented devices and closed platforms, offering actionable insights to streamline the debugging process.
Key Features:
- Automated error detection and reporting reduce manual monitoring.
- Device and OS-specific error tracking pinpoints issues in fragmented environments.
- Real-time alerts and notifications enable rapid response.
- Detailed diagnostic data accelerates debugging.
| Pros | Cons |
|---|---|
| Focused on actionable error insights, improving developer efficiency. | Limited to error monitoring, lacking full performance monitoring features. |
| Supports a wide range of platforms for cross-environment visibility. | Advanced features may require higher-tier plans. |
| Facilitates rapid debugging, reducing downtime. | Integration may be needed for full-stack visibility. |
- Pricing: Based on number of errors and users; contact Bugsnag for details.
- Best For: Teams prioritizing error detection and debugging in fragmented device environments.
5. Sentry
Sentry is an open-source application monitoring platform focused on real-time error tracking and debugging. It addresses the challenges of device fragmentation and closed ecosystems by providing detailed error context and supporting multiple platforms.
Key Features:
- Real-time error tracking keeps issues visible as they occur.
- Contextual debugging information assists in root cause analysis.
- Support for multiple programming languages and platforms increases flexibility.
- Customizable alerting adapts to team workflows.
| Pros | Cons |
|---|---|
| Open-source option available for cost-effective implementation. | Primarily focused on error monitoring. |
| Strong debugging capabilities improve response times. | May require configuration for complex environments. |
| Broad platform support for diverse development environments. | Advanced features may require paid plans. |
- Pricing: Free tier available; paid plans based on event volume and features.
- Best For: Development teams needing real-time error tracking and debugging across diverse platforms.
6. HeadSpin
HeadSpin provides performance monitoring and testing for mobile and web applications, with a focus on real device testing across global networks. It helps address device fragmentation and closed ecosystem challenges by enabling testing and monitoring on a wide range of devices and environments.
Key Features:
- Real device cloud for testing ensures accurate performance data.
- Performance monitoring across devices and locations identifies regional issues.
- Automated issue detection reduces manual effort.
- Comprehensive analytics and reporting support in-depth analysis.
| Pros | Cons |
|---|---|
| Access to a wide variety of real devices aids in replicating user issues. | Primarily focused on testing and monitoring. |
| Global testing capabilities help ensure consistent performance worldwide. | Pricing may be high for extensive device access. |
| Detailed analytics facilitate effective debugging. | Integration with existing workflows may require effort. |
- Pricing: Based on device usage and features; contact HeadSpin for details.
- Best For: Organizations requiring real device testing and monitoring across fragmented device landscapes.
7. LogicMonitor
LogicMonitor is an infrastructure monitoring platform that extends to application performance monitoring. It provides visibility into complex environments, helping organizations manage closed ecosystems and fragmented devices through unified dashboards and automated alerts.
Key Features:
- Unified infrastructure and application monitoring simplifies oversight.
- Automated discovery and alerting reduce setup time.
- Customizable dashboards offer tailored views for different teams.
- Scalable monitoring supports large environments.
| Pros | Cons |
|---|---|
| Comprehensive infrastructure coverage. | Less specialized for mobile-specific challenges. |
| Automated setup and discovery speed up onboarding. | May require customization for app-level insights. |
| Scalable for enterprise needs. | Pricing may be higher for large deployments. |
- Pricing: Based on number of monitored resources; contact LogicMonitor for a quote.
- Best For: Enterprises seeking unified monitoring across infrastructure and applications, including closed ecosystems.
8. Catchpoint
Catchpoint offers digital experience monitoring with a focus on end-user performance across diverse networks and devices. It helps organizations analyze and debug issues related to device fragmentation and closed platforms by providing real-time visibility and analytics.
Key Features:
- End-user experience monitoring delivers actionable insights.
- Real-time performance analytics support rapid troubleshooting.
- Global monitoring locations enable worldwide visibility.
- Customizable alerting and reporting fit varied organizational needs.
| Pros | Cons |
|---|---|
| Strong focus on end-user experience. | Primarily focused on experience monitoring. |
| Global reach for comprehensive monitoring. | Advanced features may require higher-tier plans. |
| Detailed analytics facilitate troubleshooting. | Integration with existing tools may be needed. |
- Pricing: Based on monitoring scope and features; contact Catchpoint for details.
- Best For: Organizations prioritizing end-user experience monitoring across fragmented devices and networks.
9. Coralogix
Coralogix is a log analytics and monitoring platform designed to help teams analyze and debug application data efficiently. It addresses the complexity and cost of data analysis in closed ecosystems by providing automated insights and scalable log management.
Key Features:
- Automated log analysis streamlines data interpretation.
- Real-time monitoring and alerting ensure timely responses.
- Scalable log storage adapts to growing data needs.
- Customizable dashboards enable focused analysis.
| Pros | Cons |
|---|---|
| Efficient log analysis and management. | Primarily focused on log data. |
| Automated insights for debugging reduce manual effort. | May require integration for full-stack visibility. |
| Scalable for organizations with increasing data demands. | Advanced analytics may require higher-tier plans. |
- Pricing: Based on data volume and feature set; contact Coralogix for details.
- Best For: Teams needing scalable log analytics and automated debugging in complex, closed environments.
10. Groundcover
Groundcover is an observability platform that provides real-time monitoring and analytics for cloud-native applications. It helps organizations manage the complexity of modern environments, including closed ecosystems and fragmented devices, by offering automated insights and streamlined debugging tools.
Key Features:
- Real-time observability for cloud-native apps keeps performance visible.
- Automated anomaly detection identifies issues quickly.
- Customizable dashboards and alerts enable tailored monitoring.
- Support for distributed environments increases flexibility.
| Pros | Cons |
|---|---|
| Modern approach to observability with automated analysis. | Primarily focused on cloud-native environments. |
| Automated insights reduce the need for manual investigation. | May require integration for mobile or legacy systems. |
| Supports distributed and cloud-native architectures. | Pricing details may vary based on usage. |
- Pricing: Based on usage and feature requirements; contact Groundcover for a quote.
- Best For: Organizations operating cloud-native applications in complex, distributed, or fragmented environments.
Benefits of the Best iOS App Monitoring Tools
- Improved User Experience: Proactively monitoring performance and errors ensures that end users encounter fewer issues and enjoy a smoother app experience. This is essential for retention and positive app reviews.
- Faster Debugging and Resolution: Comprehensive monitoring platforms reduce the time required to identify and resolve issues by providing actionable insights, session data, and detailed error reporting.
- Enhanced Visibility Across Devices: Addressing device fragmentation means teams can understand how their app performs on various iOS devices and OS versions, minimizing unexpected failures.
- Cost and Resource Efficiency: By automating issue detection, reporting, and analysis, these tools reduce manual workloads and the associated costs, allowing engineering teams to focus on feature development.
- Scalability and Flexibility: Modern monitoring tools are built to scale with an organization, supporting growing user bases and increasingly complex app architectures without significant additional overhead.
Choosing the Right iOS Monitoring Tool
- Evaluate Ecosystem Support: Consider whether the tool specializes in mobile, supports closed ecosystems, and handles device fragmentation relevant to your user base.
- Assess Integration Complexity: Review how easily the tool integrates with your existing stack, especially if you have legacy systems or require full-stack visibility.
- Prioritize Actionable Insights: Select solutions that not only collect data but also provide automated analysis, real-time alerts, and detailed diagnostic information to accelerate troubleshooting.
- Consider Scalability and Cost: Choose a platform that aligns with your growth strategy and offers transparent pricing, ensuring you can scale monitoring as your app and user base expand.
- Focus on Usability: Ensure the tool’s interface and workflows are accessible to your team, minimizing learning curves and maximizing productivity.
Conclusion
The “best” iOS app monitoring tool depends on your goals. The leading iOS app monitoring tools, including Embrace, New Relic, Datadog, Bugsnag, Sentry, HeadSpin, Catchpoint, Coralogix, and Groundcover, each address different aspects of mobile performance monitoring, from detailed session-level insights and robust error tracking to enterprise-grade observability and real-device testing at scale.
By choosing a platform that aligns with their technology stack, scalability goals, and operational priorities, organizations can enhance app stability, resolve issues faster, and deliver a consistently reliable, high-quality user experience across the iOS ecosystem.