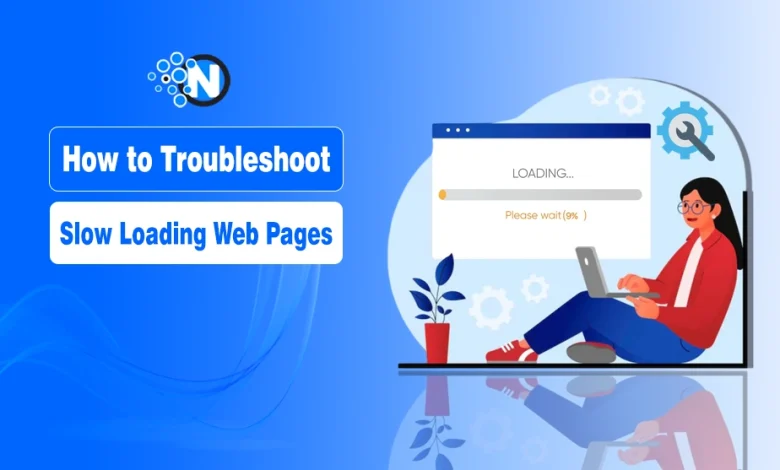
Few things are more frustrating than a sluggish website. Desktop pages load in 2.5 seconds on average. Mobile pages take 8.6 seconds. This performance gap matters because mobile accounts for 68% of web traffic. Mobile bounce rates hit 57%. Half of all visitors leave if a page takes more than three seconds to load.
Slow-loading web pages can drive away visitors, hurt SEO rankings, and damage your brand reputation. But the good news? Most performance issues are fixable if you know where to look.
In this guide, I’ll walk through the most common causes of slow loading web pages and how to troubleshoot them effectively.
Common Page Performance Killers
Large media files slow down most websites. Uncompressed images and videos consume bandwidth and increase load times. HTML, CSS, and JavaScript files without optimization create similar problems. Sites often load the same script multiple times or call duplicate libraries.
Server response times affect performance before content starts loading. The 75th percentile server response time measures 0.8 seconds on mobile and 0.6 seconds on desktop in the US. Redirect chains force browsers to make extra trips to the server. Each redirect adds latency.
| Issue | Example / Details | Impact on Speed |
| Large media files | Uncompressed images and videos increase file size and bandwidth usage | Slower load times, higher bounce rate |
| Unoptimized code | HTML, CSS, and JavaScript without minification or compression | More data to download, longer render time |
| Duplicate scripts | Loading the same library (e.g., jQuery) multiple times | Wastes resources, delays rendering |
| Server response time (TTFB) | 0.8s on mobile, 0.6s on desktop at the 75th percentile in the US | Pages feel sluggish before content even starts loading |
| Redirect chains | Multiple redirects force extra round trips to the server | Adds latency, delays page rendering |
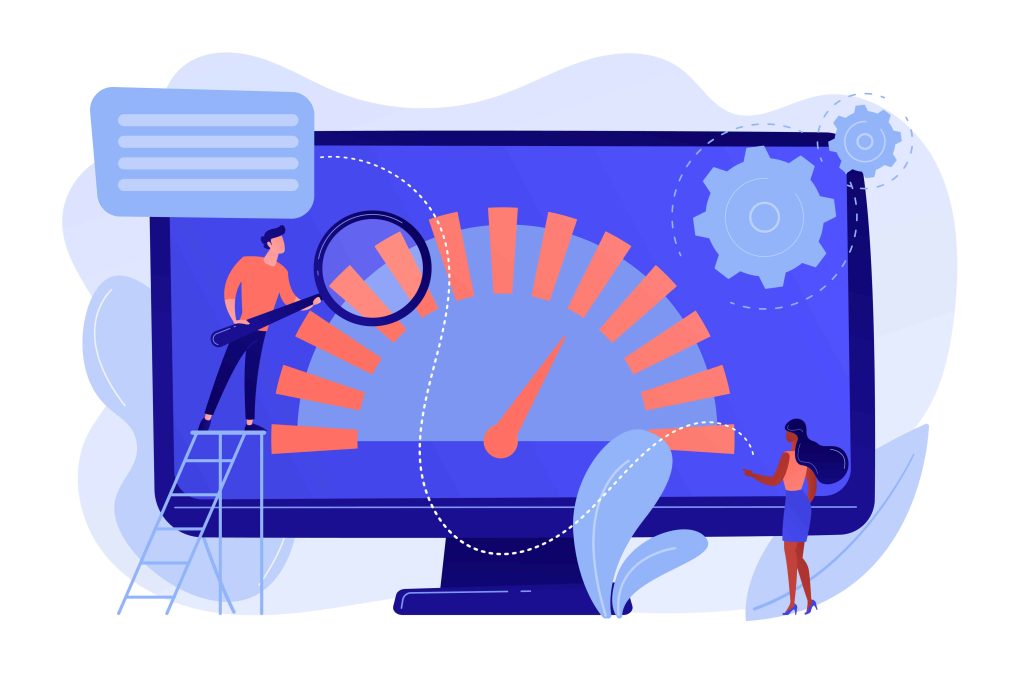
Measurement Tools That Matter
Google’s Lighthouse generates performance audits. PageSpeed Insights scores Core Web Vitals and identifies blocking resources. Chrome DevTools profiles load bottlenecks in real time. WebPageTest runs synthetic performance tests. DebugBear provides continuous monitoring.
Start with the waterfall chart in DevTools.
Open Chrome DevTools
- Right-click on your page → Inspect → go to the Network tab.
Look for large files and slow resources. Uncompressed images appear as obvious problems.
Reload the Page with DevTools Open
- Press Ctrl + R (Windows) or Cmd + R (Mac).
- This will capture the entire loading process.
Look at the Waterfall Chart
- Each request (images, scripts, CSS, etc.) shows up as a row.
- The colored bars represent how long each step (DNS lookup, connection, waiting, download) takes.
Heavy video files and unused CSS show up clearly.
Identify Large or Slow Files
- Sort by Size or Time.
- Watch for uncompressed images, big video files, or heavy scripts.
Check Time to First Byte. Desktop TTFB above 600ms indicates backend problems. Mobile TTFB above 800ms needs investigation.
Search for duplicate scripts in the Network tab. Multiple jQuery calls waste resources. Synchronous third-party widgets block rendering.
Map redirect chains using curl commands or DevTools. Remove unnecessary redirects.
Server Configuration Problems and Quick Fixes
Server settings often cause hidden performance bottlenecks. A misconfigured .htaccess file can add 200-500ms to each request.
Step-by-step: diagnose first, then fix
- Back up and test without .htaccess
- In your site root, rename .htaccess → .htaccess.bak.
- Hard-refresh the page.
- If TTFB drops a lot or the page suddenly loads faster, your .htaccess rules are part of the problem.
- For WordPress, permalinks will break; just test the homepage and a static file like /wp-includes/images/w-logo-blue.png.
- Measure TTFB before/after (quick CLI)
curl -o /dev/null -s -w "ttfb: %{time_starttransfer}s\ntotal: %{time_total}s\n" https://yourdomain.com/Run it 3–5 times with and without .htaccess to compare.
Restore .htaccess and isolate slow parts
- Put .htaccess back.
- Comment out blocks one by one (redirects, security headers, caching, WordPress block).
- After each change, test TTFB again. The slow block will reveal itself.
Fix redirect chains (biggest hidden cost)
- You should have one hop only from any variant to the final URL.
- Bad: http → www → https → trailing slash.
- Good: http or www → https final in a single rule set.
Optimize Rewrite rules
- Put redirect rules at the very top, before anything else.
- Use specific patterns, avoid .* when you can.
- Combine conditions; stop processing with [L] (and [END] if available).
- Avoid multiple passes over the same request.
Move heavy work out of .htaccess
- If you have long lists (IP blocks, complex regex, RewriteMaps), do them in the main vhost config instead.
- .htaccess is parsed on every request; keep it lean.
Set caching and compression efficiently
- Use FilesMatch or directory-specific blocks, not global wildcards.
- Prefer Brotli if available; otherwise Gzip.
- Send far-future cache headers for versioned assets.
Now re-run your curl and test on PageSpeed.
Another reason could be that the PHP memory limits are set too low, forcing constant garbage collection.
How to Check and Increase PHP Memory Limit in cPanel
- Log in to cPanel
- Go to yourdomain.com/cpanel or through your hosting dashboard.
- Enter your username and password.
- Find the PHP Settings
- In the search bar, type “Select PHP Version” or “MultiPHP INI Editor” (the exact option depends on your host).
- In the search bar, type “Select PHP Version” or “MultiPHP INI Editor” (the exact option depends on your host).
- Check Current PHP Memory Limit
- If using Select PHP Version: click Options or PHP Options.
- Look for memory_limit. The current value (e.g., 128M) is shown here.
- Increase the Limit
- Click on the memory_limit value.
- Choose a higher value (e.g., 256M or 512M, depending on your hosting plan).
- Save Changes
- If you’re in MultiPHP INI Editor, scroll down and hit Save.
- If you’re in Select PHP Version → Options, changes usually save automatically.
👉 Pro Tip: If you can’t change it via cPanel (some shared hosts lock it), you may need to edit .htaccess or wp-config.php (for WordPress) with: define(‘WP_MEMORY_LIMIT’, ‘256M’);
Database connection pools configured incorrectly create queuing delays. Problems with website hosting configurations, outdated server software, or incorrect DNS settings compound these issues.
Simple fixes produce measurable results. Enable HTTP/2 on your server to cut connection overhead by 30%. Set the PHP memory_limit to 256M minimum for WordPress sites as instructed above. Configure MySQL’s query_cache_size to 64MB for repeated queries. Check your hosting control panel for outdated PHP versions running below 8.0. Update DNS TTL values to 3600 seconds to reduce lookup frequency.
Strategies to Fix Slow Loading Web Pages
Fix Images and Videos First
Convert images to WebP or AVIF formats. These formats reduce file sizes without quality loss. Use srcset and sizes attributes for responsive images. Serve appropriate resolutions to each device type.
There are several WordPress plugins you can use for automatic conversion to WebP.
- Webp Express
- Imagify
- Smush It
Video files need adaptive streaming. Implement HLS or DASH protocols. Mobile devices should receive lower resolution versions. Compress all media assets. Use lossless compression for images that need perfect quality. Apply lossy compression elsewhere.
Code Optimization Steps
- Minify HTML, CSS, and JavaScript files.
- Tools like Terser handle JavaScript minification.
- Use cssnano for CSS files.
- Remove unused code from production builds.
- Bundle related files to reduce HTTP requests. Avoid creating single massive bundles that slow initial loads.
- Add the defer attribute to external JavaScript files. Use async for scripts that run independently.
These attributes prevent scripts from blocking page rendering. Apply lazy loading to images below the fold. The loading=”lazy” attribute works in modern browsers. Intersection Observer API provides fallback support.
For WordPress users, you can fix these issues with these plugins
- Litespeed Cache (if you are on a Litespeed-supported server like Hosting or NameCheap)
- WP Rocket (Paid Speed Optimization Tool)
- WP Fastest Cache (Free and Premium Available)
- W3 Total Cache (Premium only)
- Permatters (Premium and one of the user’s Favorite light-weight plugins)
Caching and Content Delivery
Configure Cache-Control headers for static assets. Set appropriate expiration times based on update frequency. Implement cache busting for updated files. Use versioned filenames or query strings.
Content Delivery Networks reduce latency. CDNs serve files from servers close to users. Static assets load faster from edge locations. Global audiences benefit most from CDN implementation.
Here are some CDN lists based on their free and paid tier pricing and other benefits.
| Provider | Free plan | Core features | Pricing snapshot* | Best for |
| Cloudflare | Yes | Global CDN, DDoS/WAF, HTTP/2/3, caching rules, SSL | Free tier; paid plans start at Pro/Business tiers | Small to large sites; easy start, strong security. (Cloudflare) |
| Bunny.net | No free tier (trial) | Global PoPs, image optimizer, video CDN, storage, instant purge | Pay-as-you-go from ~$0.01/GB (EU/NA); regional pricing; $1/mo minimum | Budget-friendly high performance; great for media. (bunny.net) |
| Amazon CloudFront | Yes (AWS Free Tier) | Deep AWS integration, Functions@Edge, HTTP/2/3, KV store | Usage-based; e.g., functions $0.03 per 1M reads; egress varies by region; zero fees for data transfer out from AWS origins to CloudFront | Apps already on AWS; granular control at scale. (Amazon Web Services, Inc.) |
| Fastly | Yes (starter credit) | Real-time logs, powerful edge logic/VCL, instant purge | “Start for free” with $50/mo traffic credit; then usage-based | High-traffic apps, power users, dev teams. (Fastly) |
| KeyCDN | No free tier (trial) | Anycast network, HTTP/2, free SSL, instant purge | From $0.04/GB in NA/EU (tiers drop with volume); higher in other regions | Simple, transparent pricing; straightforward setup. (KeyCDN) |
| Google Cloud CDN | No free tier (trial credits via GCP) | Tight GCP integration, HTTP/2/3, QUIC, Cloud Armor (WAF) | Usage-based by region and requests | Sites on GCP; global reach with Google network. (Google Cloud) |
| Azure Front Door (CDN) | No free tier (trial credits via Azure) | Global anycast, WAF, DSA, rules engine; Standard/Premium tiers | Usage-based; Standard/Premium pricing | Microsoft stack; note classic tiers are retiring for new onboard. (Microsoft Azure) |
| Akamai | No | Massive edge footprint, enterprise security, media delivery | Custom/quote-based (calculator guides exist) | Large enterprises, complex media at global scale. (Akamai) |
Backend Performance Matters
Database queries slow down dynamic content generation. Index frequently queried columns. Remove N+1 query problems. Cache database results when possible.
HTTP/2 and HTTP/3 protocols speed up connections. These protocols support multiplexing and header compression. Server push capabilities reduce round-trip.
Core Web Vitals Targets
Largest Contentful Paint should stay under 2.5 seconds. This metric measures when the main content becomes visible. First Input Delay needs to stay below 13ms on desktop and 60ms on mobile. Cumulative Layout Shift should remain minimal. Page elements moving during load frustrate users.
Google uses Core Web Vitals as ranking factors. First-page search results average 1.65-second load times. Sites failing Core Web Vitals lose organic search visibility.
Advanced Optimization Techniques
Preconnect to third-party domains early. Add preconnect link tags for critical external resources. This resolves DNS and establishes connections before scripts load.
Code splitting delivers only the necessary JavaScript. Webpack and Rollup support automatic code splitting. Tree shaking removes dead code from bundles.
Set fetchpriority=”high” on hero images. This improves Largest Contentful Paint scores. Brotli compression outperforms gzip for text assets. Most modern browsers support Brotli.
You can find these settings in all the WordPress plugins I have mentioned above. The most effective one is in the Perfmatters plugin.
Here’s the short, practical way to do each item with Perfmatters.
1) Preconnect to third-party domains
- WordPress → Settings → Perfmatters → Preloading.
- Under Preconnect, add the domains you use early, for example:
https://fonts.gstatic.com, https://www.googletagmanager.com, your CDN domain. - Click Save.
Set fetchpriority=”high” on the hero (LCP) image
Steps to follow:
- Perfmatters → Lazy Loading.
- Enable Lazy Load for images.
- Turn on Preload Critical Images and set it to 1 (this targets the first large image on the page—usually your hero).
Many themes + Perfmatters will automatically add fetchpriority=”high” to that LCP image.
Testing and Monitoring
Schedule regular synthetic tests. Compare performance across devices and connection speeds. Set up alerts for performance degradation. Google Analytics 4 tracks real user metrics. DebugBear provides detailed performance monitoring.
An e-commerce site improved conversions by 20% after converting product images to WebP and implementing lazy loading. A SaaS provider reduced the homepage load time from 10 seconds to 2.2 seconds on mobile devices. They minified code, added a CDN, and improved server response times by switching to managed VPS hosting.
Final Thoughts
Troubleshooting slow-loading web pages is part detective work, part optimization strategy. By systematically testing and refining your site, you’ll not only improve speed but also enhance user experience, SEO, and conversion rates.
Performance optimization requires systematic testing and targeted fixes. Measure current performance. Identify specific bottlenecks. Apply proven solutions and monitor results continuously.